Sonoma County Drowning Statistics
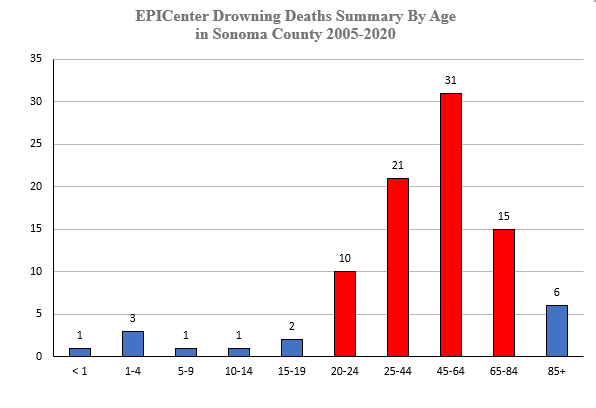

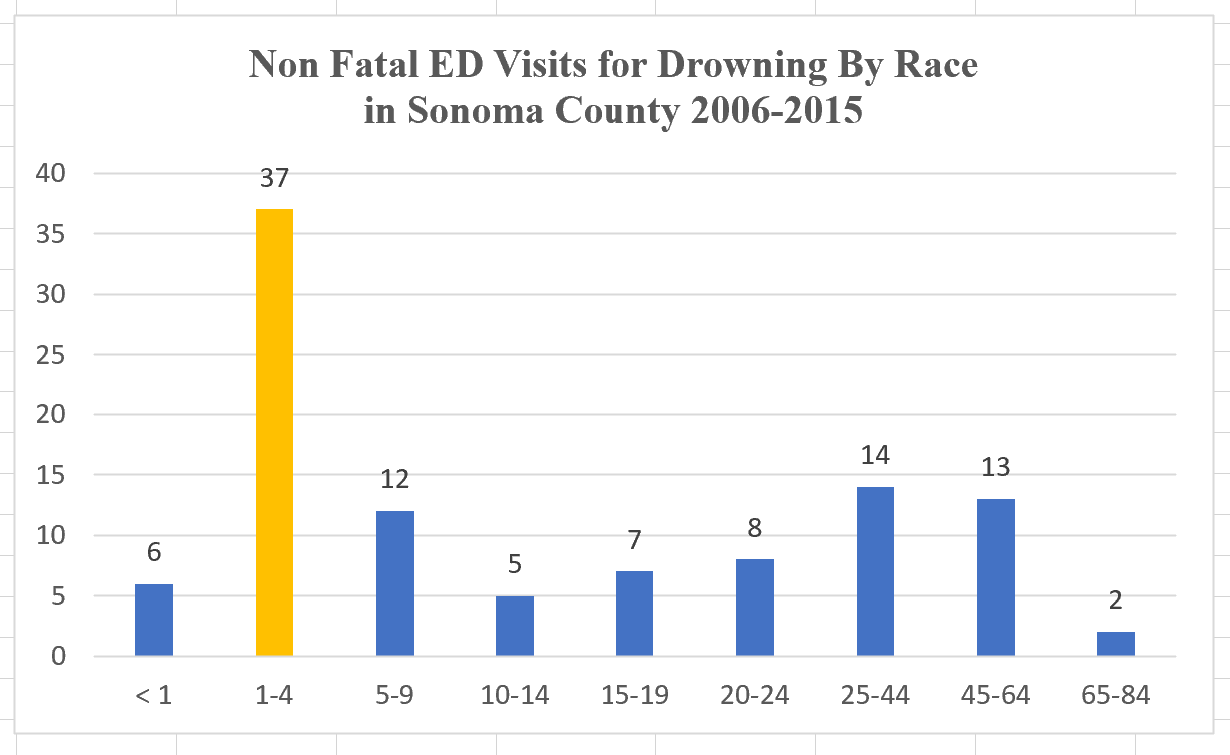
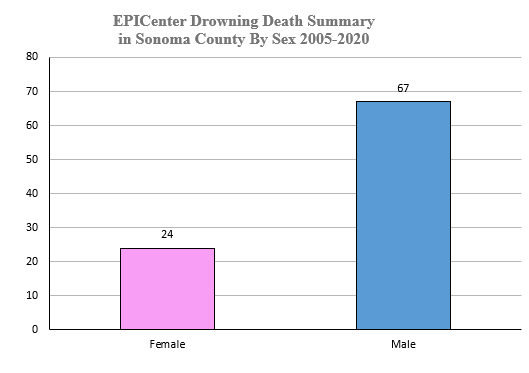
Predicted & Actual Drowning Deaths and ED Visits for Drowning refers to actual reported statistics from the California EpiCenter Online Data reporting tool, and EpiCenter defined grouping: Asian, Black, Hispanic, Other, and White categories by percent of population. EpiCenter data is multiplied by Predicted racial percent and the reported number of drowning deaths or emergency department visits.
Census Data By Race For Sonoma County: Asian 4%, Black 1%, Hispanic 27%, Other 6%, White 62%.

Predicted & Actual Drowning Deaths and ED Visits for Drowning refers to actual reported statistics from the California EpiCenter Online Data reporting tool, and EpiCenter defined grouping: Asian, Black, Hispanic, Other, and White categories by percent of population. EpiCenter data is multiplied by Predicted racial percent and the reported number of drowning deaths or emergency department visits.